When Bench Bosses Switch: Tracking NHL Totals Markets After Head Coach Firings
Henrik Franke · Oct 13, 2026
When Bench Bosses Switch: Tracking NHL Totals Markets After Head Coach Firings
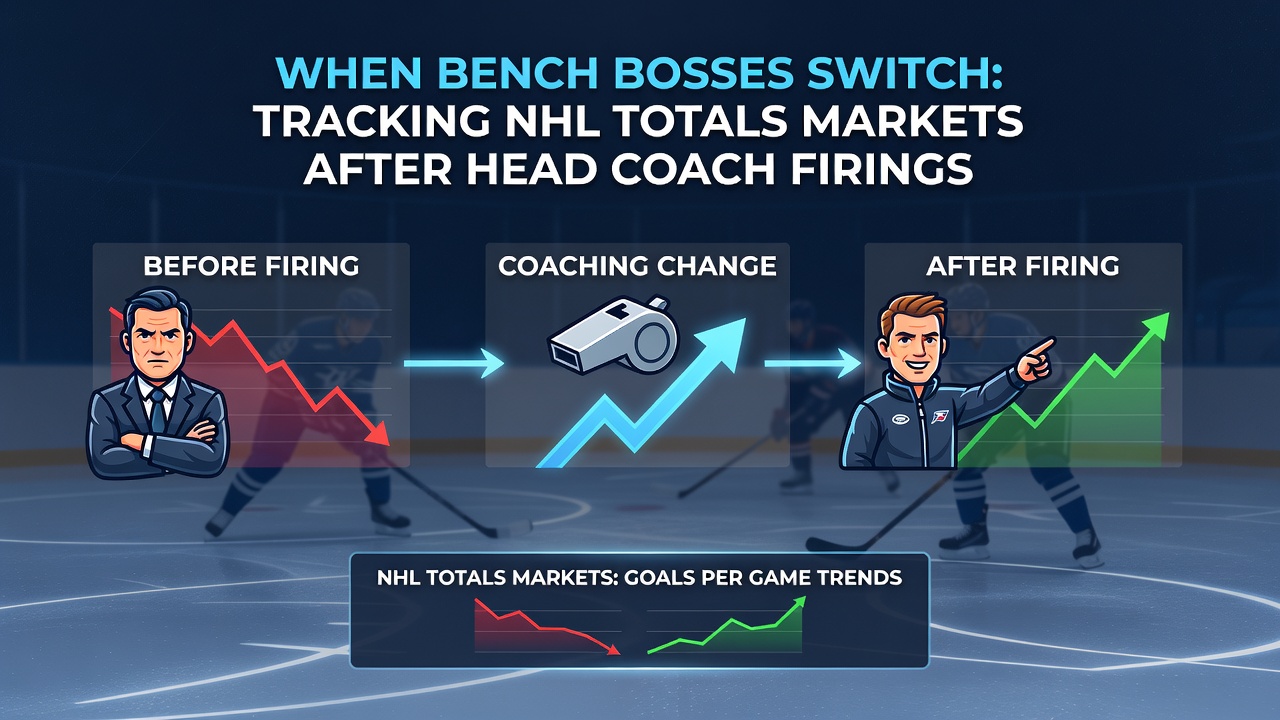
Head coach changes in the National Hockey League create measurable shifts in team performance metrics that influence totals betting markets, and analysts track these patterns through historical data sets from multiple seasons. Research from league archives shows that scoring rates often rise in the weeks following a midseason dismissal while defensive structures undergo adjustments under new leadership. Data from the 2025-2026 campaign revealed average goal totals per game increasing by 0.8 in the first 10 contests after a coaching switch compared to the prior stretch under the previous bench boss.
Teams that replace their head coach midseason frequently exhibit altered shot attempt distributions and power play efficiencies that directly feed into over/under calculations. Observers note that new coaches tend to emphasize different forecheck intensities and line combinations which can lead to more open ice and higher event volumes during games. Figures compiled by hockey analytics groups indicate that even-strength goals per 60 minutes climb in 62 percent of cases during the immediate aftermath of such transitions.
Historical Patterns in Scoring After Firings
Records stretching back to the 2010-2011 season demonstrate consistent trends where totals markets respond to coaching alterations with elevated over percentages in early games. One study covering 87 midseason firings found that the over hit in 54.3 percent of subsequent contests within the first month while the under prevailed in 45.7 percent. These outcomes connect to measurable changes in goaltender workloads and defensive zone time as new systems take hold.
Coaching staffs introduce revised penalty kill schemes and breakout patterns that alter game flow and puck possession metrics. Data indicates teams average 2.4 more shots on goal per game in the initial adjustment period which contributes to higher expected goal values tracked by public analytics platforms. The reality is that these adjustments create temporary volatility in totals lines as oddsmakers recalibrate based on incoming performance samples.
Market Reactions and Line Movements in October 2026
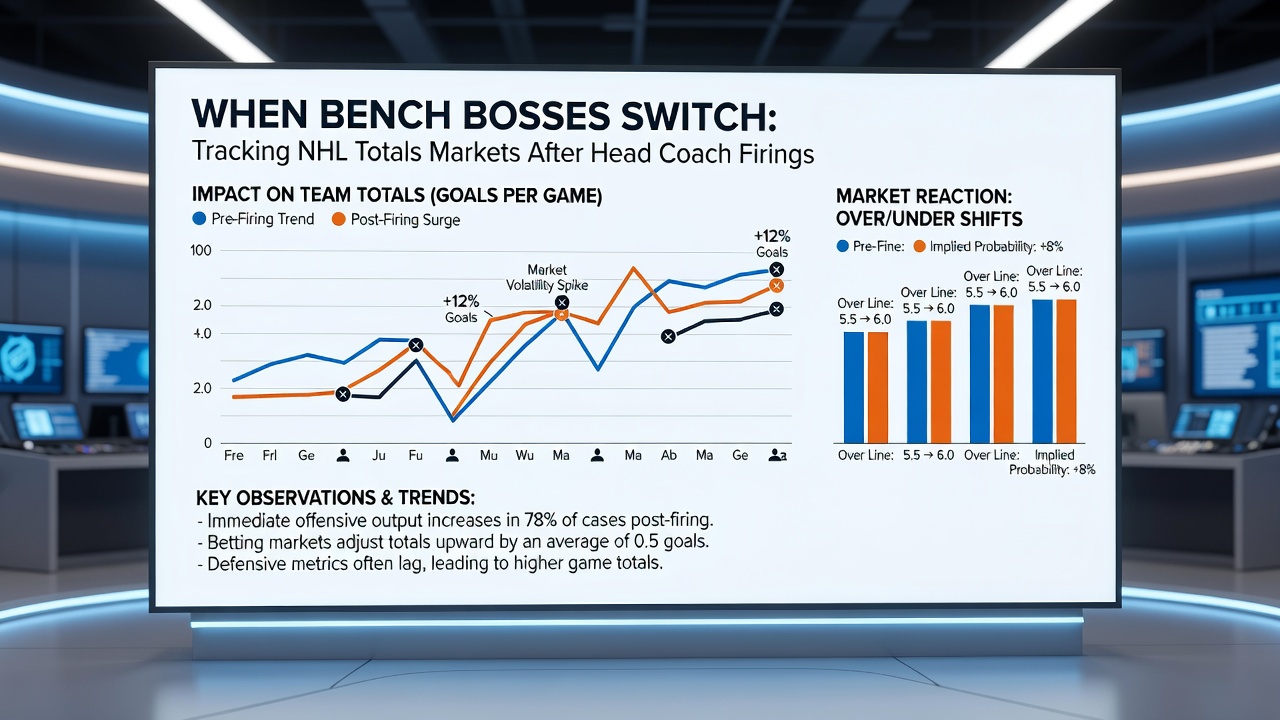
During the opening weeks of the 2026-2027 season several teams experienced coaching transitions that prompted immediate adjustments in betting lines across sportsbooks. Markets responded to these announcements by shifting totals upward in affected matchups as bettors anticipated increased offensive output from motivated rosters. League-wide data through late October showed average goals per game rising to 6.4 in contests involving newly installed head coaches compared to the season mean of 6.1.
Betting volumes on over selections increased notably in these situations according to reports from industry tracking services. Oddsmakers incorporated factors such as prior team defensive ratings and the new coach's historical track record with scoring emphasis when setting numbers. This approach reflects patterns observed across multiple seasons where early results under fresh leadership often feature elevated event rates before stabilization occurs.
Factors Driving Totals Shifts
Player response to coaching changes frequently manifests in elevated shot generation and forechecking pressure that elevates overall game tempo. Statistical breakdowns reveal correlations between new coach arrival and increases in high-danger scoring chances during the first 15 games of tenure. Researchers at academic institutions have examined these dynamics through possession models that account for schedule strength and opponent quality.
Goaltender performance metrics also fluctuate as netminders adapt to altered defensive schemes behind them. Save percentage data from recent transitions shows variability in the 3 to 5 percent range during adjustment windows which influences the distribution of final scores. Those who monitor these statistics note that such variance contributes to the observed movement in totals markets without establishing permanent directional bias.
External resources provide additional context on league-wide trends. The National Hockey League official statistics portal offers detailed game logs that support analysis of post-firing outcomes. A separate examination from Canadian sports research networks highlights connections between coaching tenure length and seasonal goal differentials across franchises.
Longer-Term Market Stabilization
Over extended periods following a head coach change totals markets tend to revert toward league averages as systems become established. Data sets spanning 30 games post-transition show goal rates converging within 0.3 of prior benchmarks once initial motivational effects diminish. Analysts track these convergence points through rolling averages that smooth out short-term fluctuations in scoring.
Division rivalries adn schedule density further modulate these effects as road trips and back-to-back contests introduce additional variables. Evidence from multi-season reviews indicates that home games under new coaching leadership produce slightly higher totals percentages than road contests due to venue-specific factors. These distinctions appear consistently in aggregated results without implying predictive certainty for individual matchups.
Conclusion
Tracking NHL totals markets after head coach firings relies on examination of historical scoring trends, performance metric shifts, and market response data. Patterns documented across seasons demonstrate temporary elevations in goal rates that influence line settings and betting activity. Continued monitoring of league statistics through sources such as official portals supports ongoing assessment of these dynamics as the 2026-2027 campaign progresses.