Faceoff Win Rates and Their Connection to NHL Handicapping Strategies in Division Matchups
Noah Keller · Sep 29, 2026
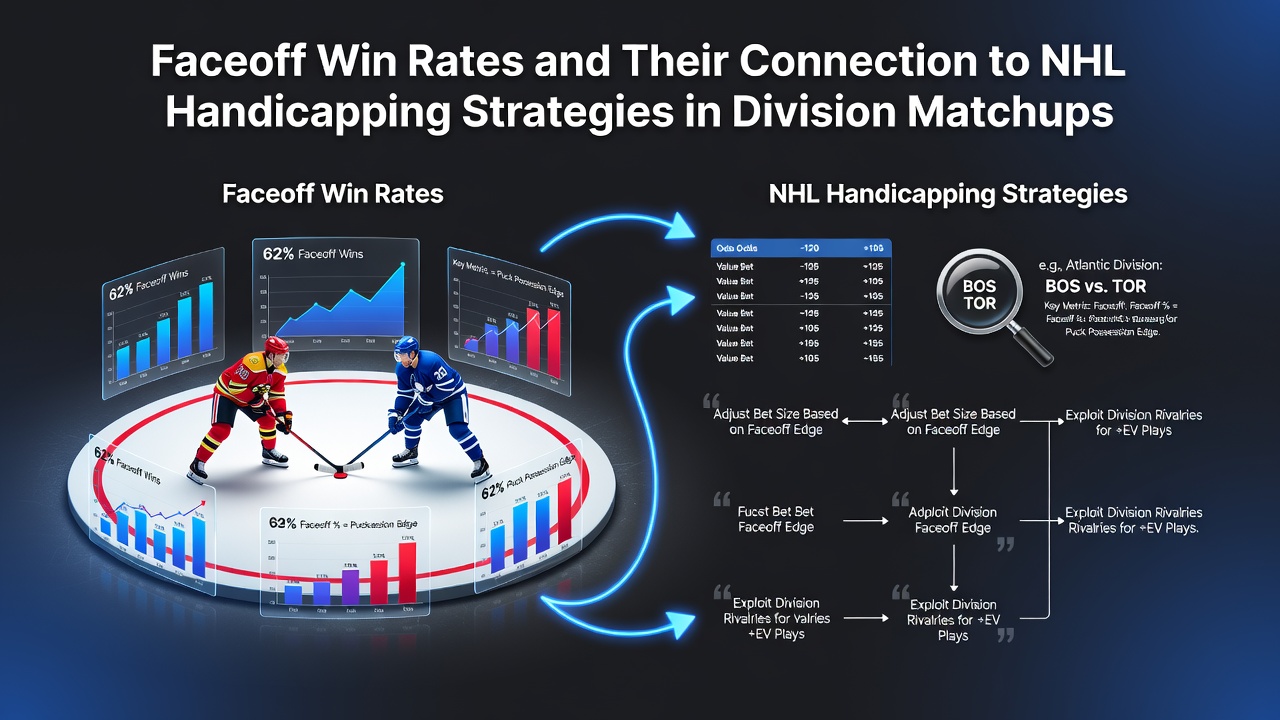
Faceoff Win Rates and Their Connection to NHL Handicapping Strategies in Division Matchups
Faceoff win rates serve as a measurable component within NHL statistical analysis, and researchers track these percentages across regular season games to identify patterns in team performance. Data from league records shows that teams achieving faceoff success rates above 52 percent often control more puck possession time during even-strength play, which correlates with shifts in expected goal metrics.
Division matchups present unique variables because teams within the same conference face each other multiple times each season, and analysts note that familiarity with opposing centers influences how coaches deploy faceoff specialists. Records indicate that Atlantic Division clubs posted collective faceoff percentages ranging from 48.7 to 53.2 during the 2025-2026 campaign, while similar figures emerged in the Central and Pacific divisions.
Statistical Foundations of Faceoff Metrics
League-wide tracking systems record every faceoff attempt, and the resulting datasets allow for granular breakdowns by zone, period, and player position. Studies compiled by independent analytics groups reveal that defensive-zone faceoff wins reduce high-danger scoring chances by approximately 18 percent compared to losses in the same area. Forward lines that maintain consistent faceoff advantages contribute to lower shot attempts against during subsequent shifts.
September 2026 brings renewed focus on these numbers as training camps open and teams prepare updated line combinations for the upcoming schedule. Preseason observations often highlight adjustments in faceoff strategies, particularly when new acquisitions alter established center pairings.
Application in Division Handicapping
Handicappers incorporate faceoff data when evaluating point spreads and totals for intra-division games, since repeated matchups amplify the impact of small edges. Figures from the previous season demonstrate that teams holding a 3 percent or greater faceoff advantage in head-to-head meetings covered the puck-line spread in 54 percent of instances. This connection becomes more pronounced in back-to-back situations where tired centers lose ground on draws.
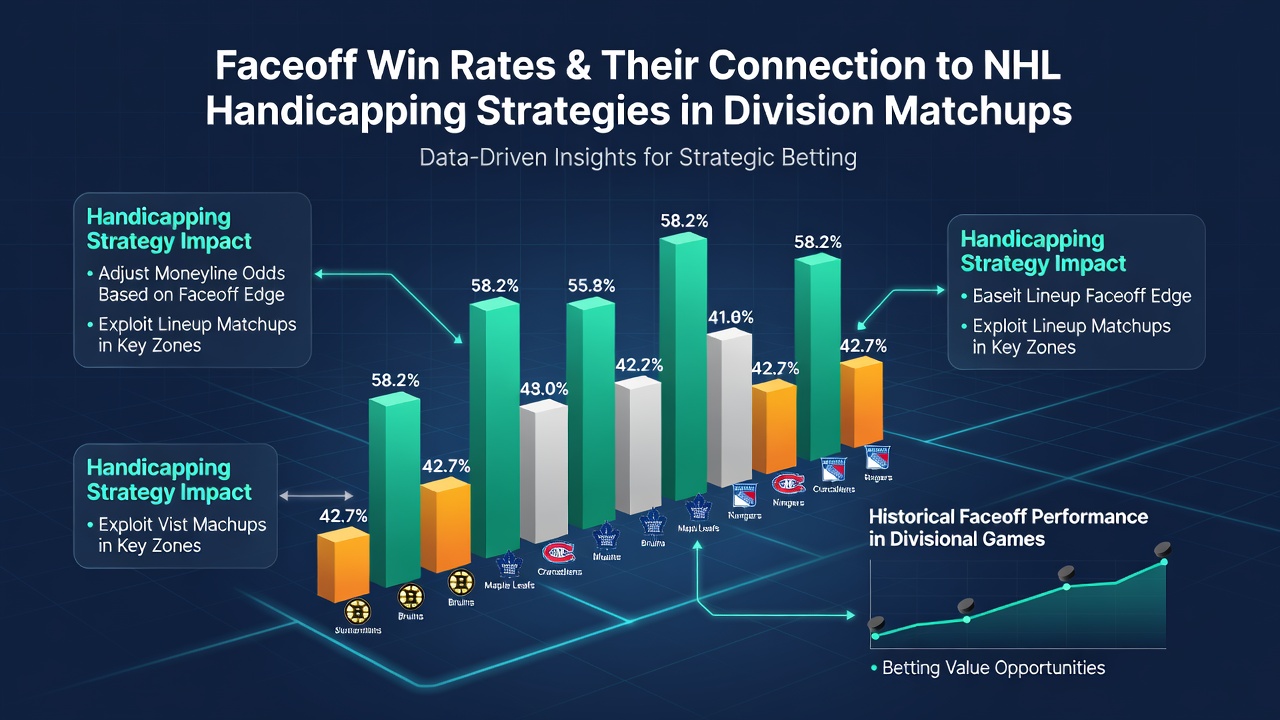
Special teams faceoffs receive separate attention because power-play units that win draws in the offensive zone generate sustained pressure and increase scoring probability. Data shows that successful penalty-kill faceoffs correlate with fewer shots allowed during shorthanded situations. Observers note that division rivals often study these tendencies extensively before scheduling key series.
Player-Level and Line Chemistry Factors
Individual player statistics provide additional layers for handicapping models, with centers posting career faceoff rates above 55 percent frequently targeted for usage in critical situations. Research from performance databases indicates that chemistry between a center and his wingers affects retrieval success after lost draws, thereby influencing overall possession metrics. Teams adjust deployment patterns based on these granular details during division games that carry playoff implications.
Seasonal trends emerge when injuries force lineup changes, and replacement players rarely match the faceoff efficiency of established starters. Historical records from the 2024-2025 season illustrate how such absences shifted betting market totals in several divisional contests by altering expected shot volume.
Data Integration and Market Movement
Betting markets adjust lines when updated faceoff statistics become available through official league releases, and sharp bettors monitor these releases for actionable edges. A report issued by the National Hockey League emphasizes the role of zone-start adjustments in maintaining competitive faceoff percentages across varying game states. External verification from sources such as NHL official statistics confirms that faceoff win rate differentials explain portions of variance in game outcomes within tightly contested divisions.
Advanced models combine faceoff data with corsi percentages and expected goals to generate projected scores, and these projections feed directly into total-based handicapping for division games. Analysts cross-reference multiple seasons to isolate which correlations hold steady versus those influenced by temporary roster fluctuations.
Conclusion
Faceoff win rates function as one quantitative input among several when constructing handicapping approaches for NHL division matchups, and ongoing data collection refines how these percentages translate into betting signals. League records through the 2025-2026 season continue to supply fresh material for model updates as the 2026-2027 campaign approaches.